
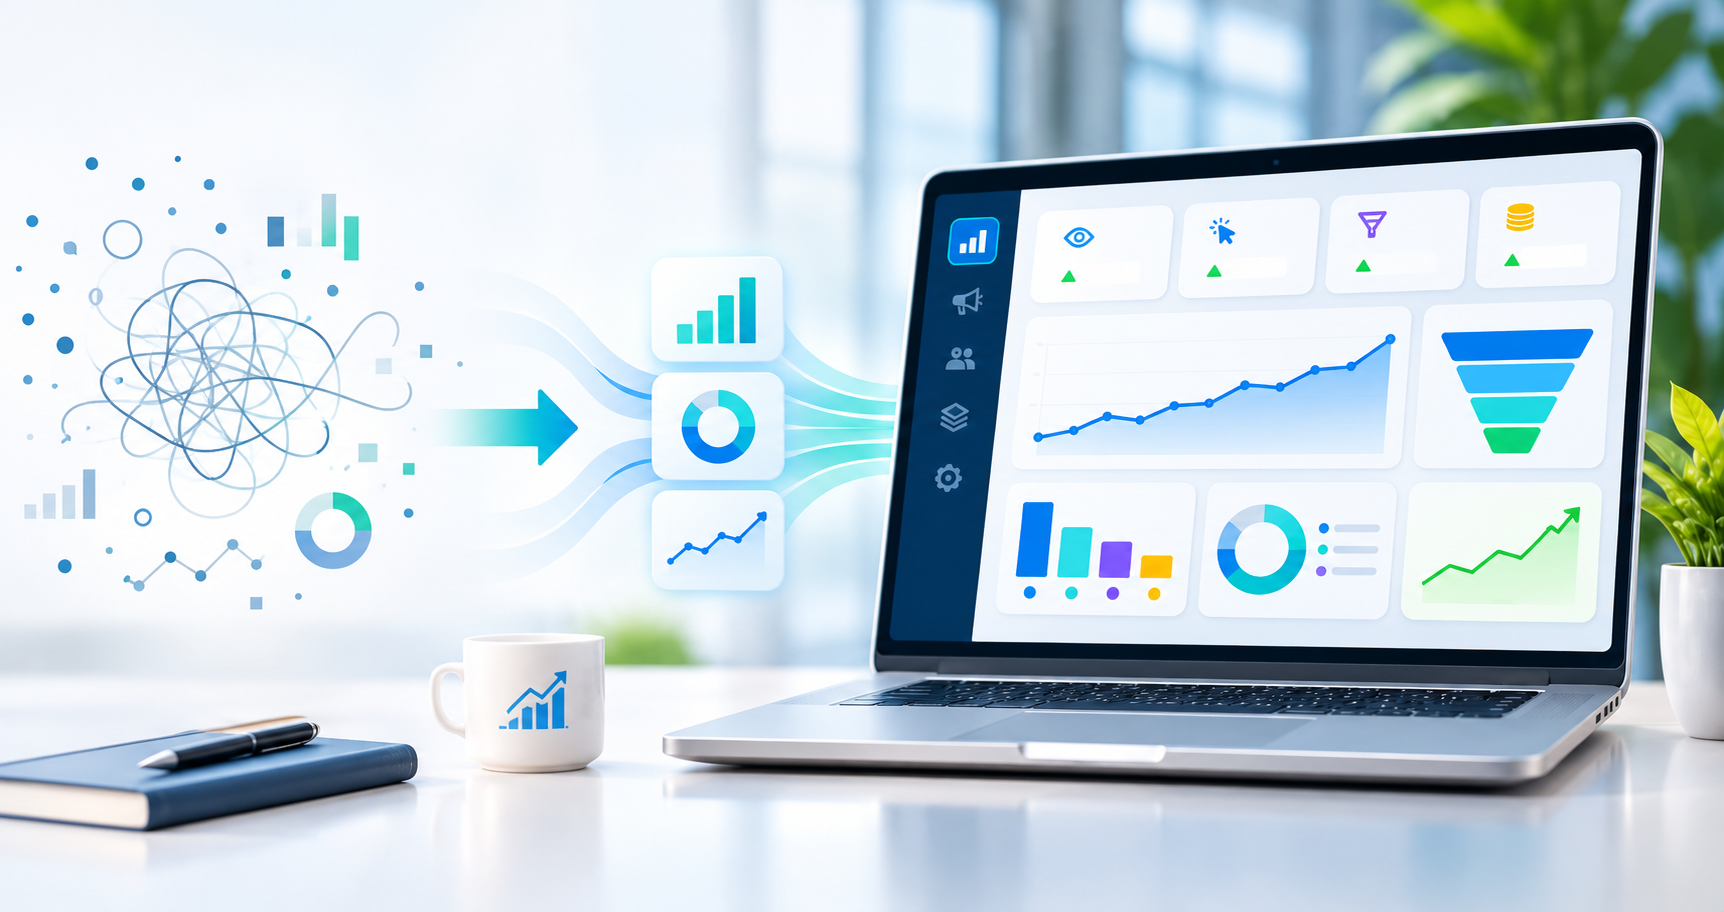
Every click, scroll, and sale leaves a trail of data. For digital marketers, that data is the clearest picture of what’s working and what isn’t.
Without it, you’re guessing. You might spend thousands on ads that bring in the wrong people, or keep posting content that nobody reads.
With it, you can see which channels bring in customers, which pages lose visitors, and where your budget does the most good.
Data analytics has become a core part of marketing work, not a side task for specialists. And it has gotten more complex.
Privacy rules limit tracking. AI tools help sort through large data sets. Search platforms report traffic in new ways.
This article explains why data analytics matters for digital marketers today. It covers the key metrics to track, the tools to use, common mistakes, and simple ways to turn numbers into better decisions. Here’s what you need to know.
Table of Contents
What Data Analytics Means in Marketing
Data analytics is the process of collecting, measuring, and making sense of information about your marketing. That includes website visits, ad clicks, email opens, form fills, sales, and more.
Most marketing analysis falls into four types:
- Descriptive: What happened? For example, website traffic dropped 10% last month.
- Diagnostic: Why did it happen? Maybe a top-ranking page lost its position in search.
- Predictive: What’s likely to happen next? Past trends can show when demand will rise.
- Prescriptive: What should you do about it? This is where data turns into an action plan.
Many marketers stop at the first type. The real value comes from moving through all four.
Why It Matters More Now Than Before
Marketing budgets are under closer watch. Business owners and leadership teams want proof that every dollar brings something back. A marketer who can show clear results has an easier time keeping and growing a budget.
The channels have also changed. Google’s AI Overviews answer many questions right on the results page, so some content gets seen without getting clicked. Social platforms change their algorithms often. And browsers block more tracking than they did a few years ago.
In this kind of setting, gut feeling isn’t enough. Data helps you spot shifts early and adjust before small problems turn into big ones.
It Shows Where Your Money Should Go
One of the biggest benefits of analytics is smarter spending. When you know the cost per lead or cost per sale for each channel, you can move money to what works.
Say your Google Ads campaign brings in leads at $40 each, and your Facebook campaign brings them in at $90. If both lead types close at the same rate, shifting budget toward Google makes sense. Without the data, you might split the money evenly and waste half of it.
Analytics also helps you find the point where extra spend stops paying off. Every channel has a limit. Past a certain budget, costs rise, and results flatten.
It Helps You Understand Your Audience
Data tells you who your customers are and how they behave. You can see which devices they use, what times they’re most active, which pages they visit, and what makes them leave.
This helps with targeting. If most of your buyers come from mobile, your landing pages need to work well on a phone. If a certain age group or location converts better, you can focus ads there.
It also helps with messaging. When you see which headlines, offers, or topics get the most response, you learn what your audience cares about.
It Makes Content and SEO Work Smarter
Content takes time to create. Analytics shows which pieces earn traffic, which ones bring leads, and which ones do nothing.
Google Search Console is especially useful here. It shows the search terms people use to find your site, how often your pages appear, and how often they get clicked. A page with many impressions but few clicks may need a better title or meta description.
You can also find gaps. If people search for a topic you haven’t covered, that’s a content idea backed by real demand.
And with AI search growing, tracking impressions and brand mentions matters alongside clicks.
It Fixes Leaks in the Customer Journey
Most visitors don’t buy on their first visit. They move through steps, like reading a blog post, viewing a service page, and then filling out a form. At each step, some people drop off.
Funnel reports show where those drops happen. If many people reach your checkout page but few finish, something on that page is causing friction. It might be a long form, a surprise shipping fee, or a slow load time.
Tools like Microsoft Clarity and Hotjar add more detail. Heatmaps and session recordings show where people click, how far they scroll, and where they get stuck.
Key Metrics Every Marketer Should Track
The right metrics depend on your goals. But most marketers should keep an eye on a core set.
Traffic and Engagement
- Sessions and users
- Traffic sources, like organic, paid, social, email, and referral
- Engagement rate and average engagement time
- Top landing pages
Conversions
- Conversion rate
- Number of leads or sales
- Form completions, calls, and bookings
Cost and Revenue
- Cost per click (CPC)
- Cost per lead or cost per acquisition (CPA)
- Return on ad spend (ROAS)
- Customer lifetime value (LTV)
Avoid tracking too many numbers. A short list you check often is better than a long report nobody reads.
Tools Worth Knowing
You don’t need expensive software to start. Many strong tools are free or low cost:
- Google Analytics 4 (GA4): Tracks website and app behavior.
- Google Search Console: Shows search performance and technical issues.
- Data Studio (formerly Looker Studio): Builds dashboards that pull data from many sources.
- Google Tag Manager: Manages tracking codes without editing site files.
- Ad platform dashboards: Google Ads, Meta, LinkedIn, and TikTok all have built-in reports.
- CRM systems: HubSpot, Salesforce, and others connect marketing to actual sales.
For larger data sets, BigQuery lets you export GA4 data and run deeper analysis.
Giving Credit to the Right Channel
A customer might see a social ad, read a blog post a week later, and then search for your brand and buy. Which channel gets the credit?
This is called attribution. Older models gave all credit to the last click. GA4 and Google Ads now use data-driven attribution, which spreads credit based on how each step affected the sale.
No model is perfect. Some companies also use marketing mix modeling, which looks at overall trends instead of tracking each person. It has become more popular as user-level tracking gets harder. The key is to pick a method, stick with it, and compare results over time.
Tracking in a Privacy-First World
Privacy laws and browser changes have made tracking less complete. Many users decline cookies. Some browsers block trackers by default.
This means your reports may undercount real activity. To reduce the gap, many teams now use:
- Consent mode, which adjusts tracking based on user choices
- Server-side tracking, which sends data through your own server
- First-party data, like email lists and CRM records
Be honest about the gaps when you share reports. Treat numbers as strong signals, not perfect counts.
How AI Is Changing Marketing Analytics
AI tools now help marketers find patterns faster. GA4 flags unusual changes in traffic or conversions. Some platforms let you ask questions in plain language and get charts in return. AI can also summarize long reports and suggest areas to look at.
But AI can still get things wrong. It may misread data or draw conclusions that don’t hold up. Always check the source numbers before acting on an AI summary.
Common Mistakes to Avoid
- Tracking vanity metrics like likes or page views without linking them to goals
- Not setting up conversion tracking correctly
- Looking at data once a quarter instead of weekly
- Changing too many things at once, so you can’t tell what worked
- Ignoring small sample sizes and drawing big conclusions
- Building reports nobody reads
Build a Habit of Using Data
Analytics works best as a routine. Set a weekly time to review your main numbers. Write down what changed and one action you’ll take. Over a few months, these small reviews add up to much better results.
Your team should actively build dashboards to explain what the numbers mean. You should be generating reports regularly to ensure you’re seeing the trends and reacting accordingly.
Guesswork Shifts to Clarity
Data analytics turns marketing from guesswork into a clear process. It shows where your money works hardest, what your audience wants, and where customers drop off.
You don’t need to be a data scientist. Start with a few key metrics, use free tools, and check them often. The more you use data to guide decisions, the better your results will get.

Brooke Sullivan is a Content Specialist and Outreach Manager at Ringo Media, a digital marketing agency. With hands-on experience in SEO, content marketing, and link building, she helps businesses grow organic traffic and build online authority. Her work centers on creating content and outreach campaigns that deliver real, measurable results. When she is not writing, she enjoys exploring new marketing tools and strategies.